Why ROI matters more than rent income
A property generating $2,400 per month in rent sounds better than one generating $1,800 per month. But if the first cost $800,000 to buy and the second cost $280,000, the cheaper property is almost certainly the stronger investment.
Rental income in isolation tells you nothing about performance. Return on investment — expressed as a percentage — lets you compare properties fairly, track how performance changes over time, and identify which assets in your portfolio are working hardest.
In rental property analysis, "net profit" can include rental cash flow, principal paydown, appreciation, and financing effects depending on your definition and time period. ROI is useful only when you explicitly define both the return component and the investment base. For this reason, most investors track multiple metrics together: gross yield, net yield, and cash-on-cash return.
ROI vs. other rental property metrics
These metrics are related, but they answer different questions. Mixing them can lead to wrong conclusions.
- Gross Yield: Fast screening metric based on rent and purchase price only.
- Net Yield: Operational performance after operating expenses, before mortgage.
- Cash-on-Cash Return: Cash yield on your out-of-pocket investment after mortgage payments.
- ROI: A broader return concept that must be defined clearly.
1. Gross Rental Yield
Gross yield is the starting point — simple, fast, and useful for quick comparisons. It measures annual rental income against the property's purchase price, before any expenses are deducted.
What it tells you: How much rent you earn relative to what you paid. It ignores all running costs, so it overstates actual returns — but it's useful for quickly screening properties before running deeper numbers.
2. Net Rental Yield
Net yield is gross yield with expenses removed. This is the metric that actually tells you whether a property is profitable on an ongoing basis.
Annual Net Operating Income = Annual Rent − Operating Expenses
(Expenses = maintenance, insurance, property tax, management fee, utilities — excluding mortgage)
What expenses to include:
- Maintenance and repairs
- Property insurance / landlord insurance
- Property tax, council rates, assessment, quit rent, or local equivalents
- Property management fees (if applicable)
- Utilities paid by landlord
- Service charges / strata or condo maintenance fees
- Vacancy allowance — an estimate for expected periods without a paying tenant
What to exclude from net yield: Mortgage repayments. Mortgage is a financing cost, not an operating cost. Net yield measures the property's performance independent of how you financed it.
3. Cash-on-Cash Return
Cash-on-cash return is the most useful metric for leveraged investors — those who used a mortgage to buy their property. It measures the actual cash return on the actual cash you invested (your down payment plus upfront costs), after all expenses including mortgage repayments.
Annual Pre-Tax Cash Flow = Annual Rent − Operating Expenses − Mortgage Payments
Total Cash Invested = Down Payment + Closing Costs + Renovation / Setup Costs
For leveraged investors, this is often the clearest metric for understanding how much cash the property returns relative to the cash invested. A property with a 6% gross yield can still produce negative cash-on-cash returns if the mortgage is large and expenses are high.
What you need to calculate ROI
- Property costs: purchase price, down payment, closing costs, and setup/renovation spend.
- Income inputs: annual rent plus other recurring income, adjusted for vacancy.
- Operating expenses: taxes, insurance, maintenance, management, fees, utilities, and reserves.
- Financing: annual mortgage payments when calculating cash-on-cash return.
If you are also preparing for tax time, the Rental Property Tax-Time Reconstruction Checklist covers how to organise income records, expenses, receipts, and mortgage statements property by property before meeting your CPA.
Worked Example: Comparing Two Properties
Here is a side-by-side comparison of two properties to show why gross yield alone is misleading.
If you want to test your own numbers, use the Rental Property Cash Flow & ROI Calculator to estimate cash flow, yield, and cash-on-cash return.
Property B earns less in rent, but outperforms Property A on every return metric that matters. Without running the full numbers, this comparison is invisible.
Track your rental returns in one dashboard
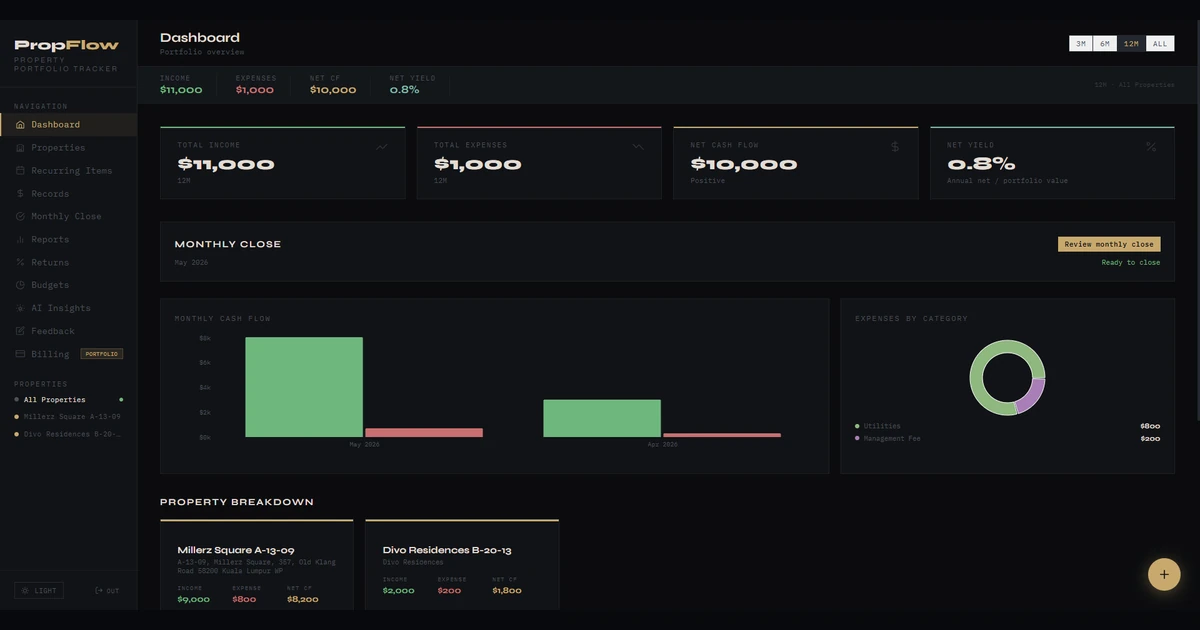
PropFlow is designed to help landlords and property investors track rental income, expenses, cash flow, and return metrics — so you can see how each property is performing without relying on scattered spreadsheets.
Start Tracking Your Portfolio →Monthly review workflow
- Reconcile the month’s income and expenses by property.
- Confirm recurring items and add any missing records.
- Review net cash flow and return metrics for each property.
- Investigate exceptions such as vacancy, unexpected repairs, or rising operating costs.
Common ROI calculation mistakes
- Ignoring vacancy, reserves, or irregular maintenance costs.
- Leaving out one-time setup costs from total cash invested.
- Mixing net yield and cash-on-cash definitions.
- Comparing properties without normalizing for financing structure.
- Tracking portfolio totals only and missing property-level underperformance.
FAQs
Does ROI include principal paydown and equity gains?
Not always. Base cash-flow ROI usually uses annual pre-tax cash flow. If you want a total-return view, define it explicitly to include appreciation and principal paydown.
What vacancy rate should I use?
Use an assumption appropriate for your market and property type, and apply it consistently in your effective income estimate.
Should CapEx and major repairs be counted?
Yes. They should be included in your long-term return model and reserve planning so your ROI is not overstated.
Stop Calculating This in Spreadsheets
The formulas above are straightforward for one property. For two, three, or five properties — each with different purchase prices, expense structures, and financing — tracking return metrics in a spreadsheet becomes error-prone and time-consuming.
PropFlow is a rental property cash-flow and ROI tracking dashboard for individual landlords and property investors. It is designed to help you track rental income, expenses, cash flow, and return metrics across your portfolio in one place — without relying on scattered spreadsheets.